Determine the influence of the internal knots of a control polygon
Source:R/influence_of_iknots.R
influence_of_iknots.RdDetermine the influence of the internal knots of a control polygon
Usage
influence_of_iknots(x, verbose = FALSE, ...)

# S3 method for class 'cpr_cn'
influence_of_iknots(
  x,
  verbose = FALSE,
  margin = seq_along(x$bspline_list),
  n_polycoef = 20L,
  ...
)Value
a cpr_influence_of_iknots object. A list of six elements:
- original_cp
- coarsened_cps
- restored_cps
- d
- influence
- chisq
Examples
x <- seq(0 + 1/5000, 6 - 1/5000, length.out = 5000)
bmat <- bsplines(x, iknots = c(1, 1.5, 2.3, 4, 4.5), bknots = c(0, 6))
theta <- matrix(c(1, 0, 3.5, 4.2, 3.7, -0.5, -0.7, 2, 1.5), ncol = 1)
cp0 <- cp(bmat, theta)
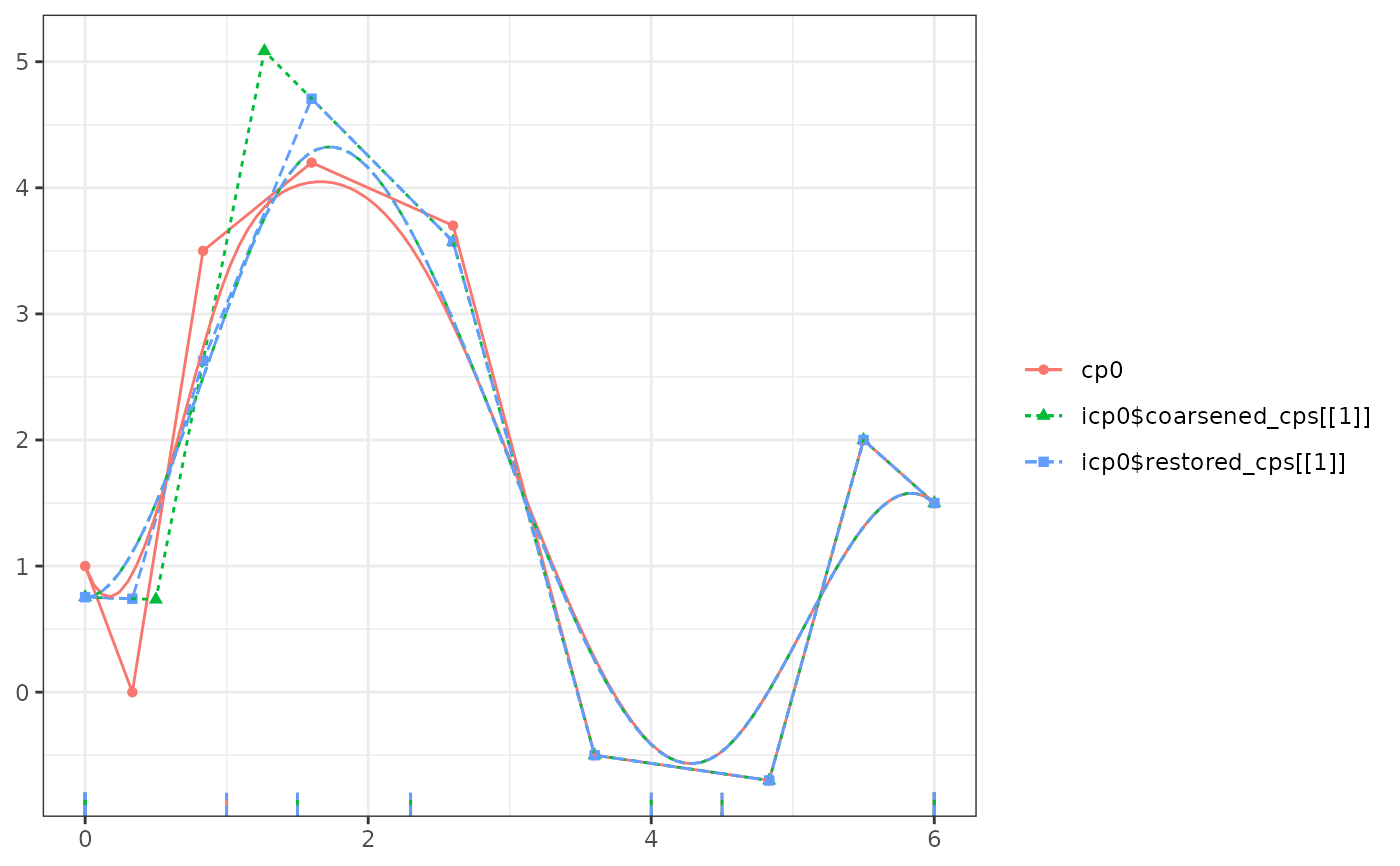
icp0 <- influence_of_iknots(cp0)
plot(cp0, icp0$coarsened_cps[[1]], icp0$restored_cps[[1]], color = TRUE, show_spline = TRUE)
#> Warning: Removed 38 rows containing missing values or values outside the scale range
#> (`geom_rug()`).
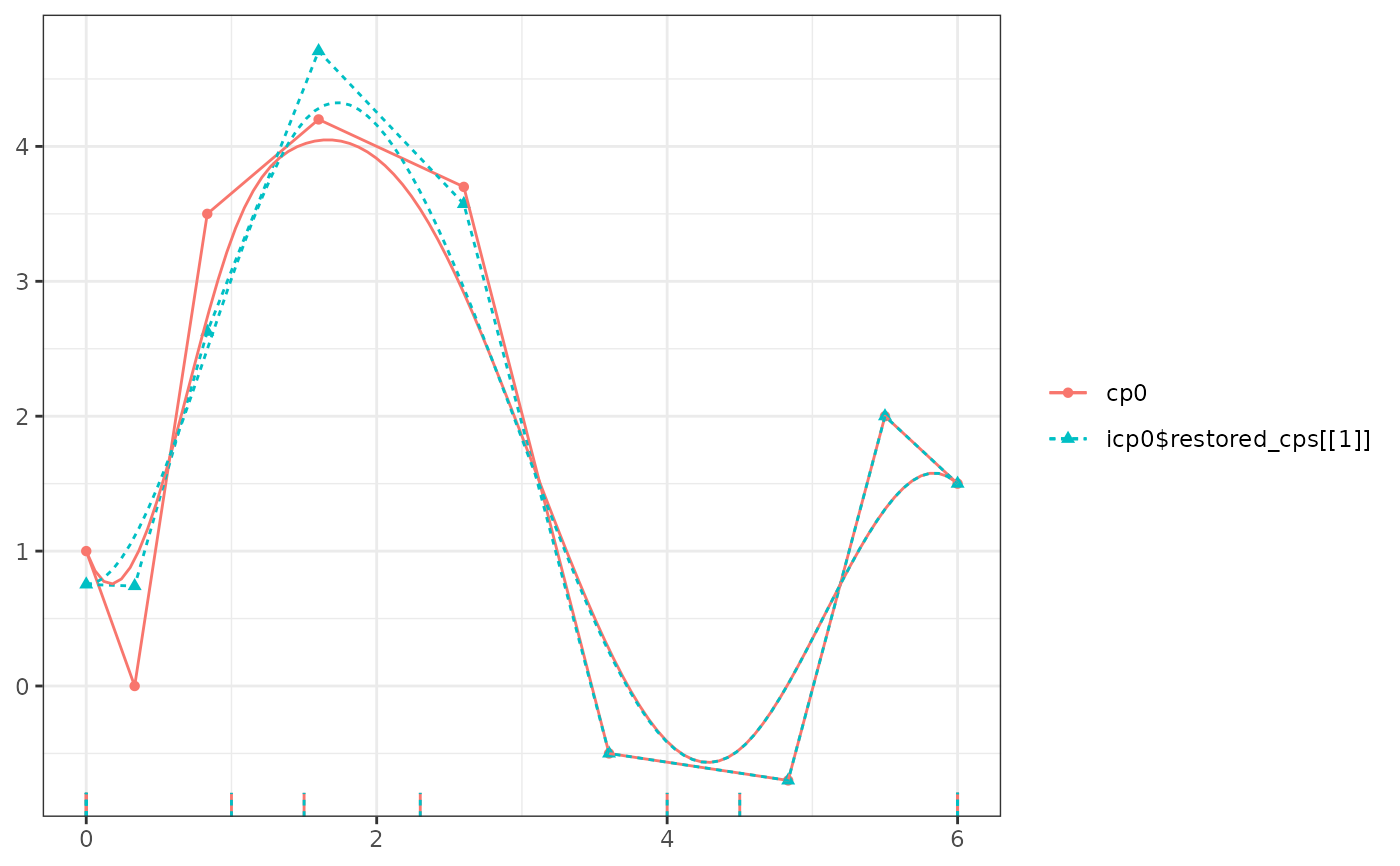
 plot(cp0, icp0$restored_cps[[1]], color = TRUE, show_spline = TRUE)
#> Warning: Removed 26 rows containing missing values or values outside the scale range
#> (`geom_rug()`).
plot(cp0, icp0$restored_cps[[1]], color = TRUE, show_spline = TRUE)
#> Warning: Removed 26 rows containing missing values or values outside the scale range
#> (`geom_rug()`).
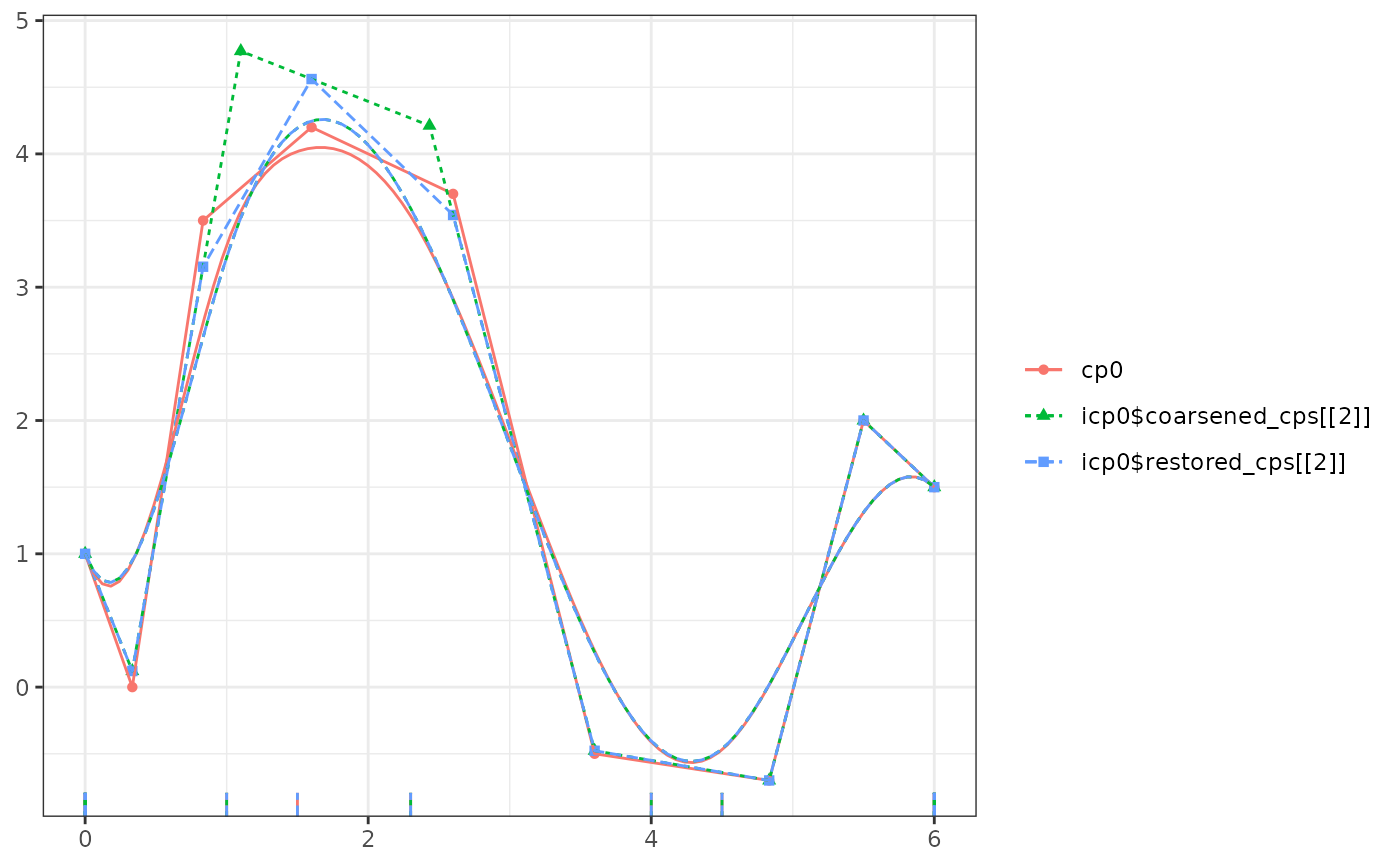
 plot(cp0, icp0$coarsened_cps[[2]], icp0$restored_cps[[2]], color = TRUE, show_spline = TRUE)
#> Warning: Removed 38 rows containing missing values or values outside the scale range
#> (`geom_rug()`).
plot(cp0, icp0$coarsened_cps[[2]], icp0$restored_cps[[2]], color = TRUE, show_spline = TRUE)
#> Warning: Removed 38 rows containing missing values or values outside the scale range
#> (`geom_rug()`).
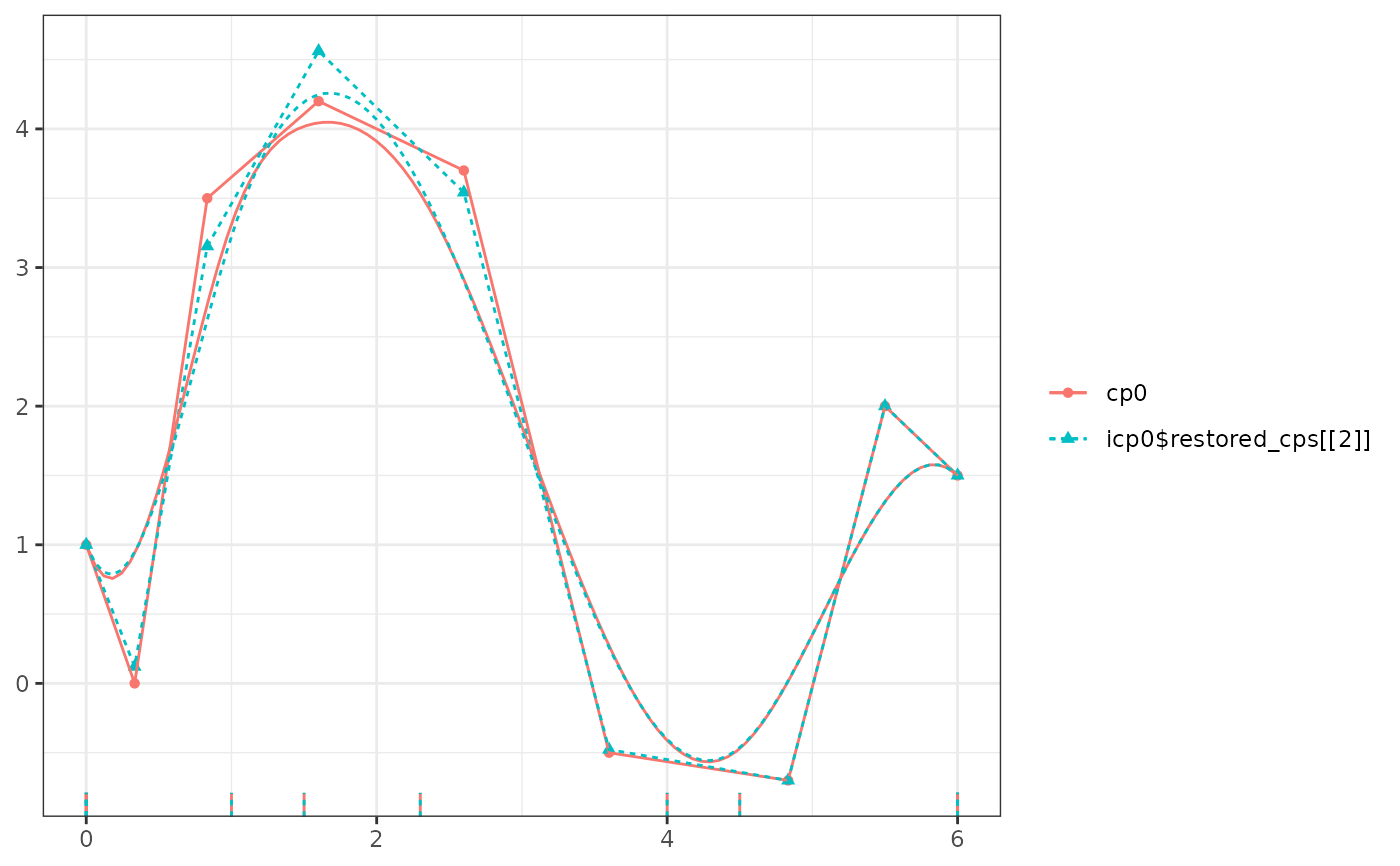
 plot(cp0, icp0$restored_cps[[2]], color = TRUE, show_spline = TRUE)
#> Warning: Removed 26 rows containing missing values or values outside the scale range
#> (`geom_rug()`).
plot(cp0, icp0$restored_cps[[2]], color = TRUE, show_spline = TRUE)
#> Warning: Removed 26 rows containing missing values or values outside the scale range
#> (`geom_rug()`).
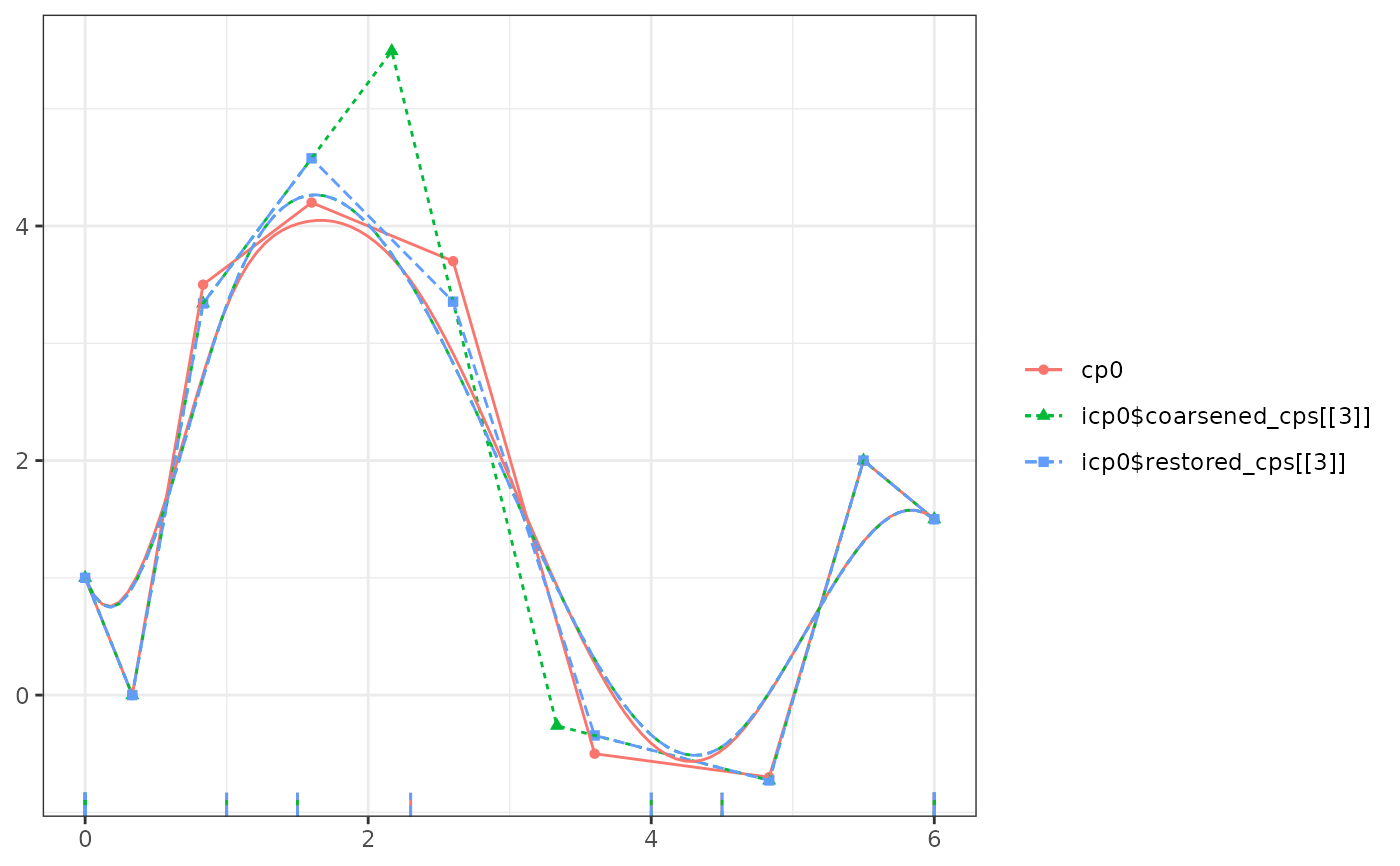
 plot(cp0, icp0$coarsened_cps[[3]], icp0$restored_cps[[3]], color = TRUE, show_spline = TRUE)
#> Warning: Removed 38 rows containing missing values or values outside the scale range
#> (`geom_rug()`).
plot(cp0, icp0$coarsened_cps[[3]], icp0$restored_cps[[3]], color = TRUE, show_spline = TRUE)
#> Warning: Removed 38 rows containing missing values or values outside the scale range
#> (`geom_rug()`).
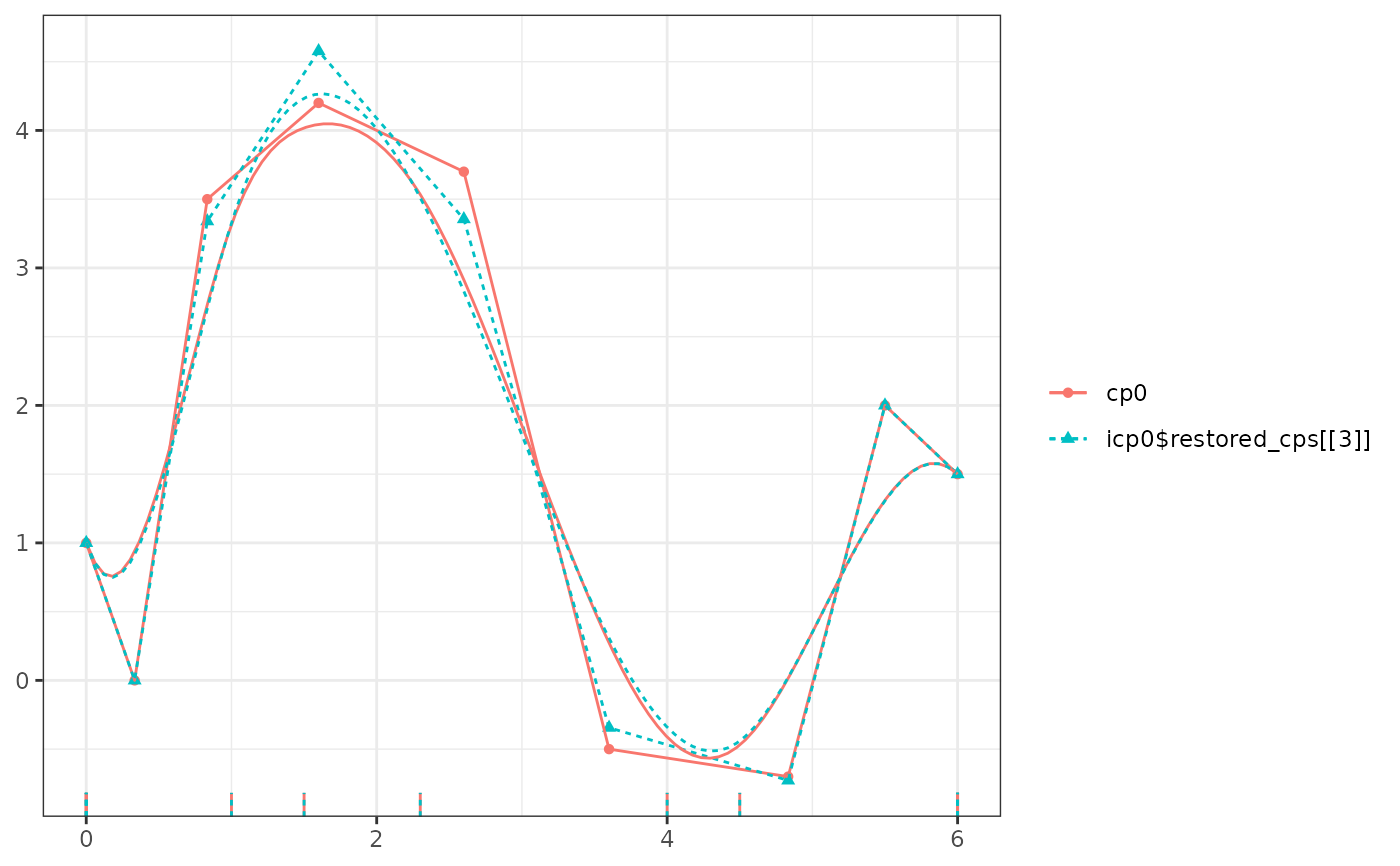
 plot(cp0, icp0$restored_cps[[3]], color = TRUE, show_spline = TRUE)
#> Warning: Removed 26 rows containing missing values or values outside the scale range
#> (`geom_rug()`).
plot(cp0, icp0$restored_cps[[3]], color = TRUE, show_spline = TRUE)
#> Warning: Removed 26 rows containing missing values or values outside the scale range
#> (`geom_rug()`).
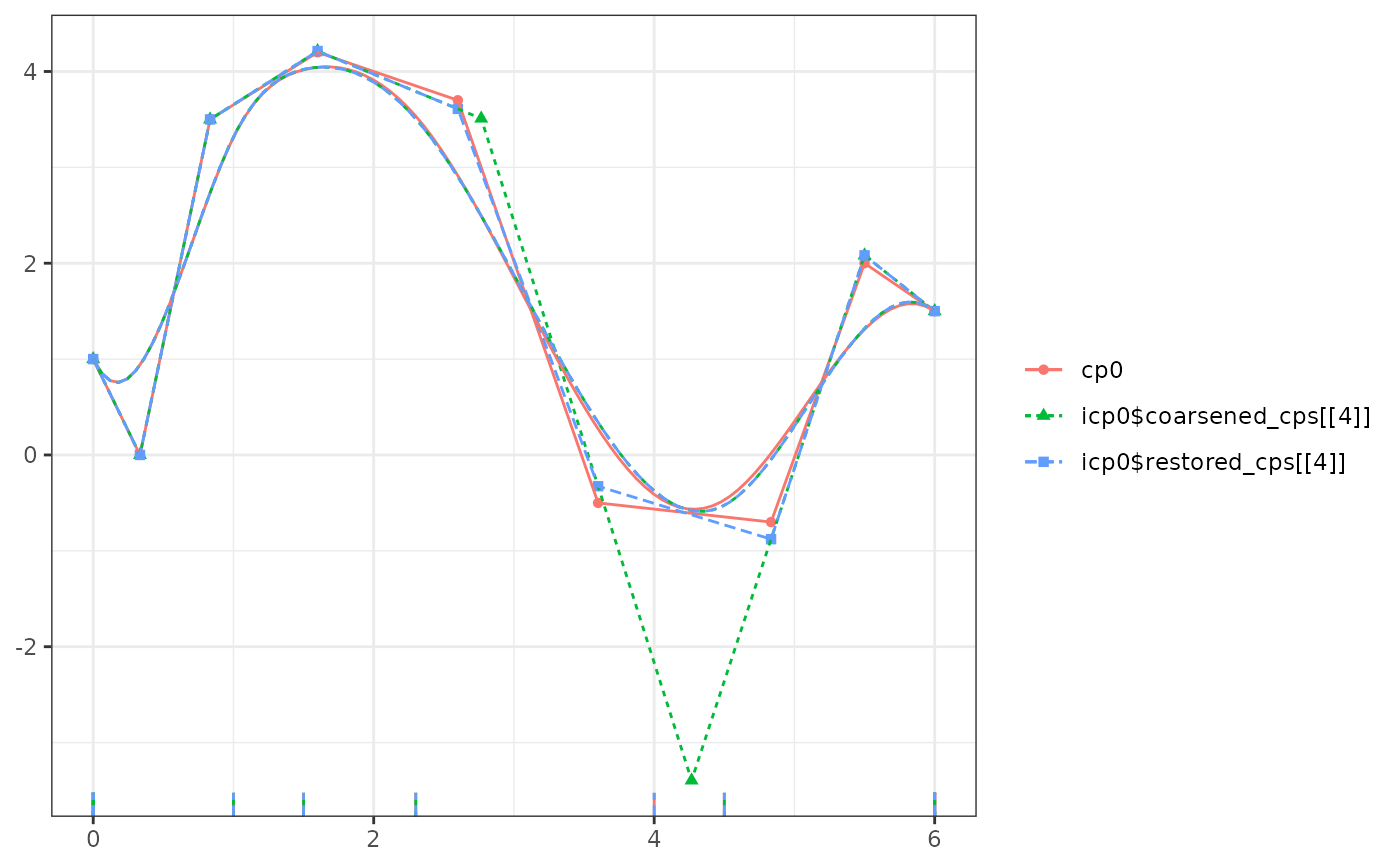
 plot(cp0, icp0$coarsened_cps[[4]], icp0$restored_cps[[4]], color = TRUE, show_spline = TRUE)
#> Warning: Removed 38 rows containing missing values or values outside the scale range
#> (`geom_rug()`).
plot(cp0, icp0$coarsened_cps[[4]], icp0$restored_cps[[4]], color = TRUE, show_spline = TRUE)
#> Warning: Removed 38 rows containing missing values or values outside the scale range
#> (`geom_rug()`).
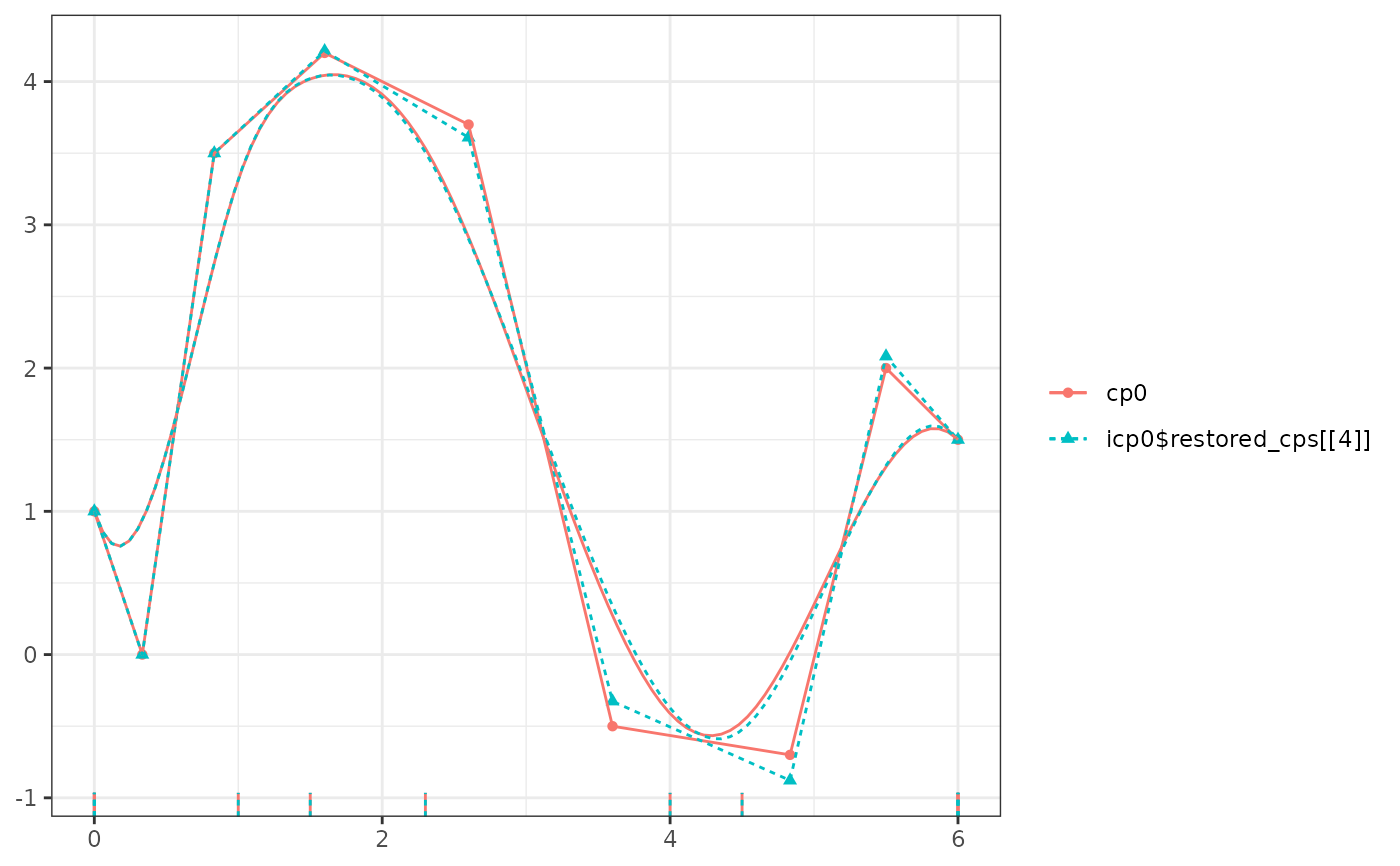
 plot(cp0, icp0$restored_cps[[4]], color = TRUE, show_spline = TRUE)
#> Warning: Removed 26 rows containing missing values or values outside the scale range
#> (`geom_rug()`).
plot(cp0, icp0$restored_cps[[4]], color = TRUE, show_spline = TRUE)
#> Warning: Removed 26 rows containing missing values or values outside the scale range
#> (`geom_rug()`).
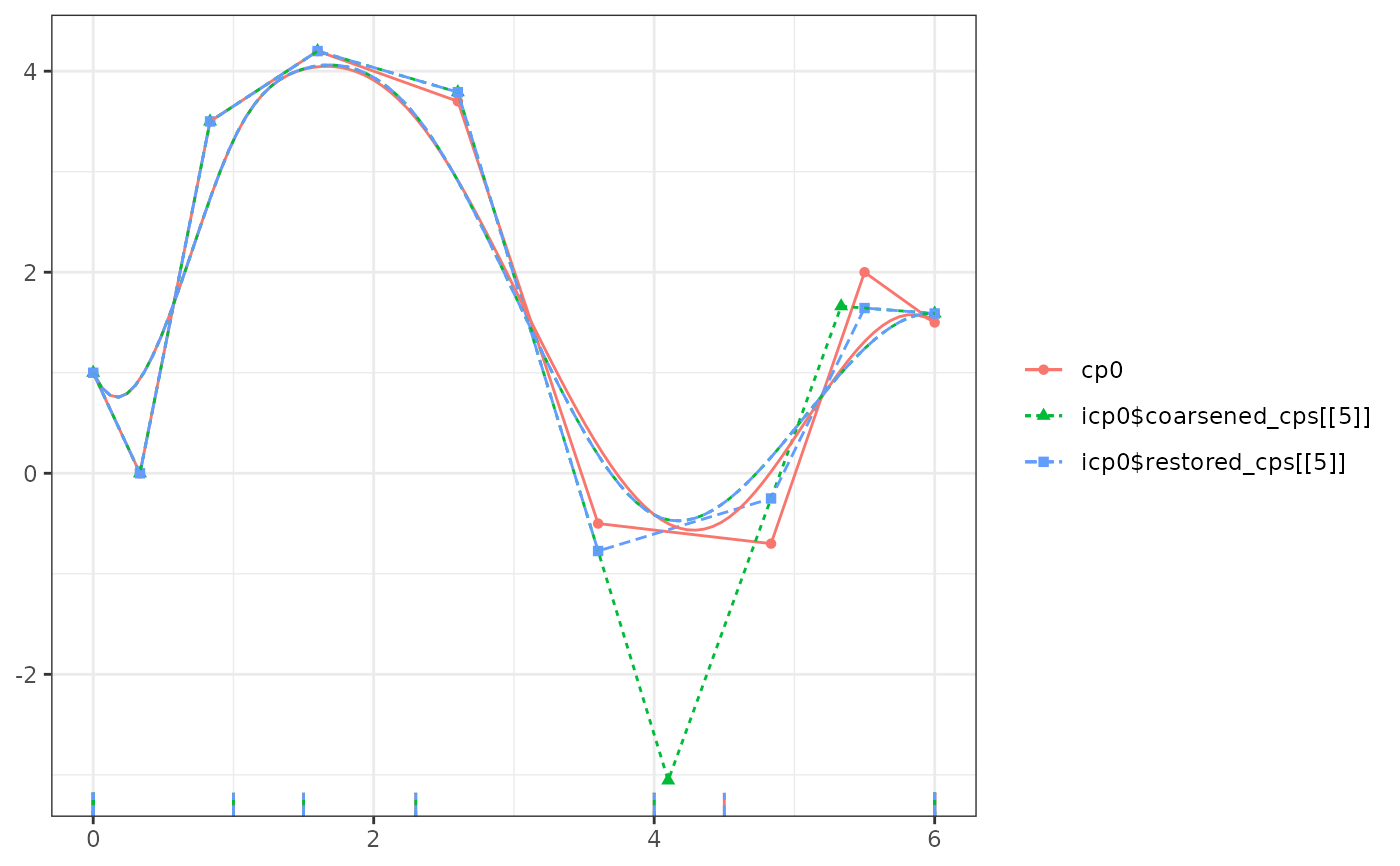
 plot(cp0, icp0$coarsened_cps[[5]], icp0$restored_cps[[5]], color = TRUE, show_spline = TRUE)
#> Warning: Removed 38 rows containing missing values or values outside the scale range
#> (`geom_rug()`).
plot(cp0, icp0$coarsened_cps[[5]], icp0$restored_cps[[5]], color = TRUE, show_spline = TRUE)
#> Warning: Removed 38 rows containing missing values or values outside the scale range
#> (`geom_rug()`).
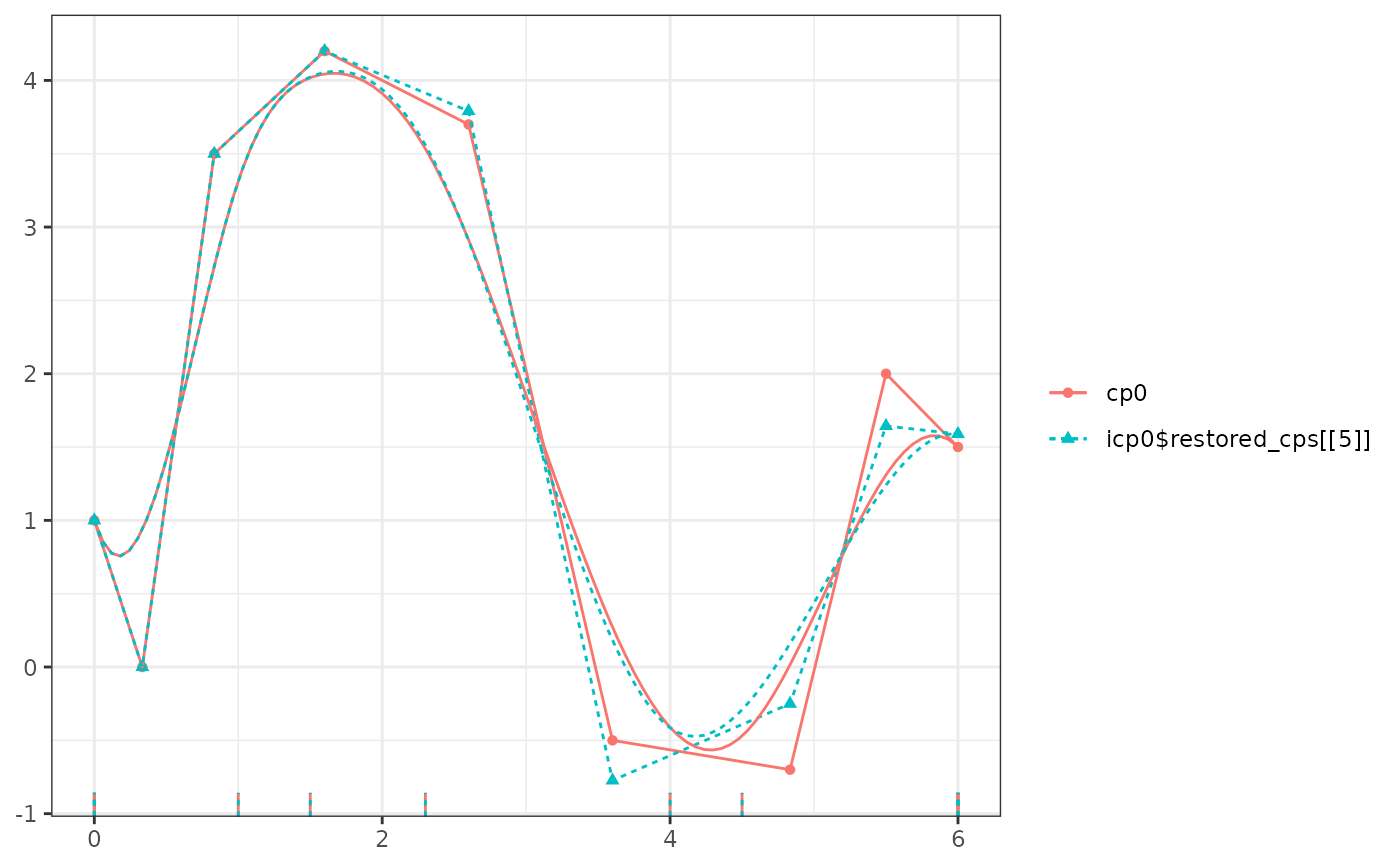
 plot(cp0, icp0$restored_cps[[5]], color = TRUE, show_spline = TRUE)
#> Warning: Removed 26 rows containing missing values or values outside the scale range
#> (`geom_rug()`).
plot(cp0, icp0$restored_cps[[5]], color = TRUE, show_spline = TRUE)
#> Warning: Removed 26 rows containing missing values or values outside the scale range
#> (`geom_rug()`).
 # When the cp was defined by regression
df <- data.frame(x = x, y = as.numeric(bmat %*% theta) + rnorm(5000, sd = 0.2))
cp1 <- cp(y ~ bsplines(x, iknots = c(1, 1.5, 2.3, 3, 4, 4.5), bknots = c(0, 6)), data = df)
icp1 <- influence_of_iknots(cp1)
icp1
#> xi_5 xi_6 xi_7 xi_8 xi_9 xi_10
#> 1.527558e+00 2.092028e-01 6.455326e-02 8.016729e-05 2.272326e-02 2.738202e-01
# When the cp was defined by regression
df <- data.frame(x = x, y = as.numeric(bmat %*% theta) + rnorm(5000, sd = 0.2))
cp1 <- cp(y ~ bsplines(x, iknots = c(1, 1.5, 2.3, 3, 4, 4.5), bknots = c(0, 6)), data = df)
icp1 <- influence_of_iknots(cp1)
icp1
#> xi_5 xi_6 xi_7 xi_8 xi_9 xi_10
#> 1.527558e+00 2.092028e-01 6.455326e-02 8.016729e-05 2.272326e-02 2.738202e-01